Introduction
Keeping track of what’s happening in your Sentinel workspace is not just about compliance – it’s about understanding trends, costs, and incident response. In this post, I share two custom solutions that help you get a better view of your Sentinel environment: one focused on usage analytics, and the other on weekly management-level reporting.
The Challenge
Sentinel workspaces generate a lot of data, but surfacing the right insights for different audiences is not always straightforward. Security teams and management often need answers to questions like:
- Which tables are driving the most data ingestion and cost?
- How do usage patterns change week over week?
- What is the incident trend for the past week?
- How quickly are incidents being closed?
- What are the most common incident types and alert sources?
The built-in dashboards are useful, but sometimes you need more tailored views or want to automate regular reporting for different stakeholders.
Sentinel Workspace Usage Analytics
Problem: It’s hard to get a clear, historical view of which tables are consuming the most data, how usage changes week to week, and what that means for your costs.
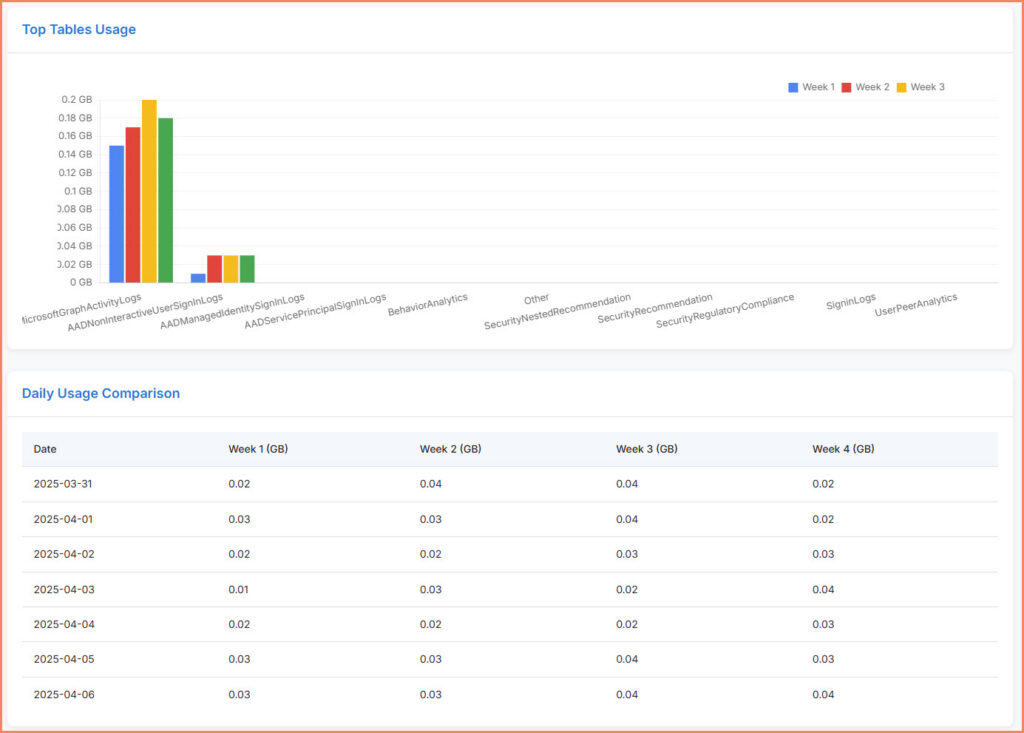
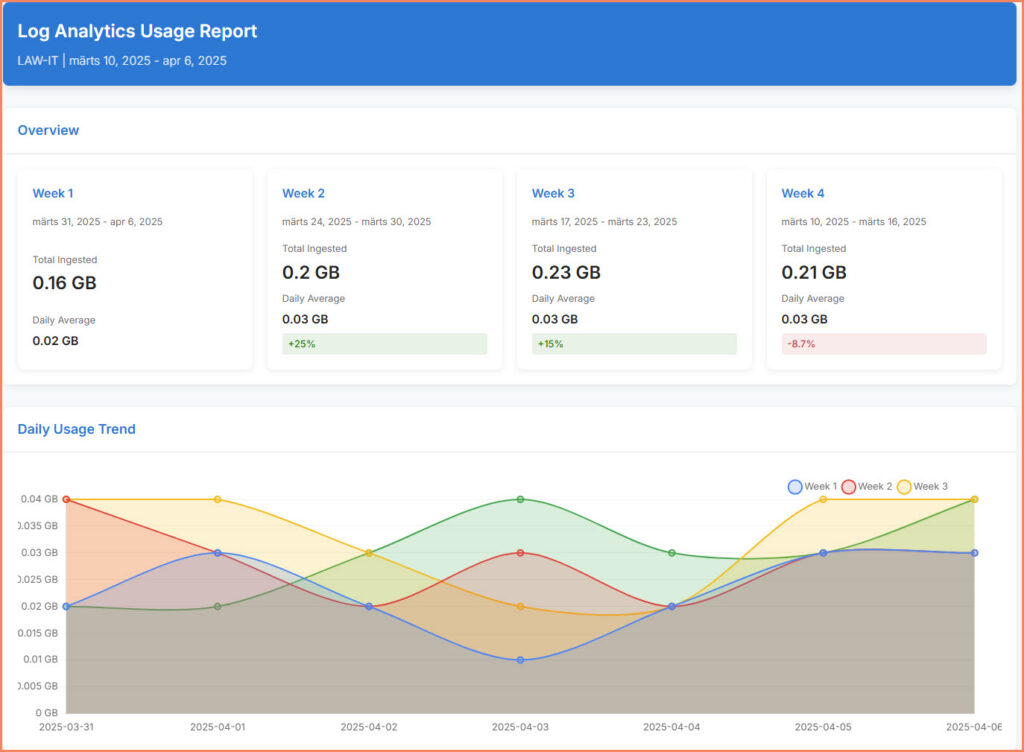
Solution: One solution analyzes your Sentinel (Log Analytics) workspace usage for the past N weeks, breaking down ingestion by table and by day. It generates an HTML report with:
- Weekly usage summaries(total and daily average GB)
- Trends and comparisons between weeks
- Top tables by ingestion
- Daily usage charts
- Table-by-table and day-by-day comparisons
This helps you spot spikes, optimize retention, and understand where your data volume is coming from.
Sample Output
Sentinel Weekly Management Report
Problem: Management and stakeholders need a regular summary of incident activity, trends, and key metrics – without having to log in and click through dashboards.
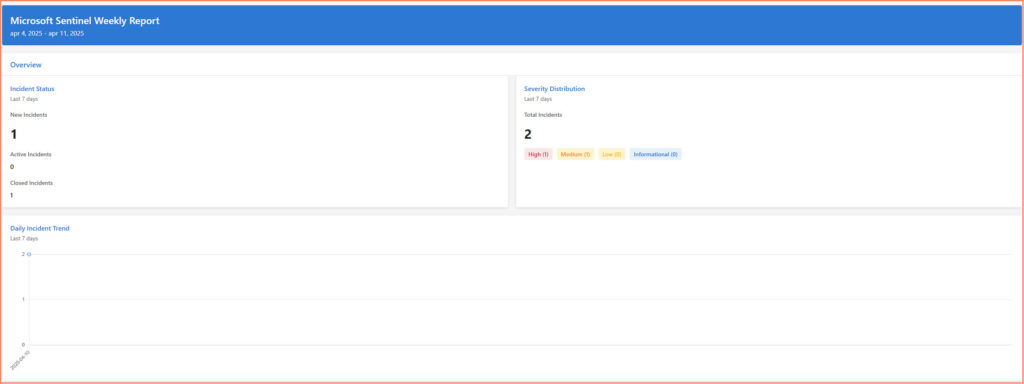
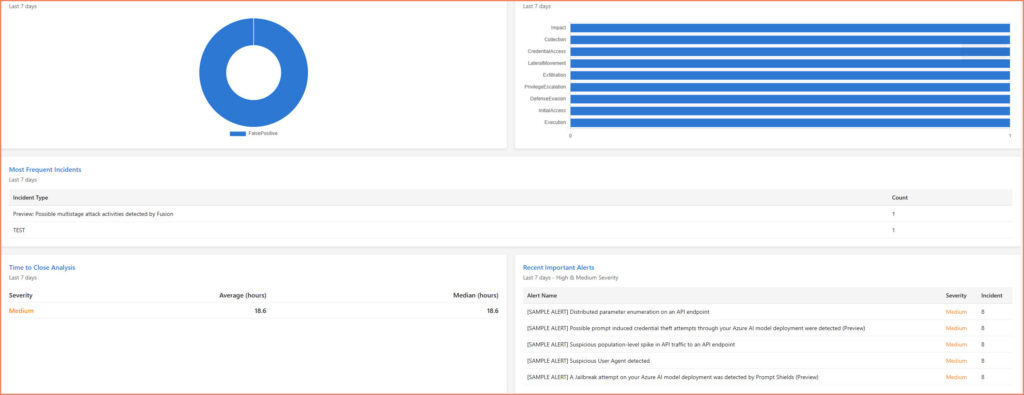
Solution: Another solution builds a weekly HTML report that covers:
- Incident status breakdown (new, active, closed)
- Severity distribution
- Daily incident trends
- Most frequent incident types
- Time to close analysis
- Recent important alerts
- Table usage statistics
The report is visually structured for quick review and can be scheduled to run automatically, making it easy to keep management informed.
Sample Output
Why These Solutions?
Both were built to address real reporting gaps:
- For cost management, capacity planning, and understanding ingestion patterns.
- For regular, management-friendly summaries of security operations.
They are designed to be run on a schedule, generate HTML reports for sharing, and can be customized for your own queries or reporting needs.
Summary
If you’re working with Microsoft Sentinel, you know how important it is to have the right insights at your fingertips. The two solutions covered here – one for workspace usage analytics, the other for weekly management reporting – are designed to make your life easier. Whether you’re tracking data growth, keeping an eye on costs, or making sure incidents are handled quickly, these approaches help you stay on top of what matters most in your Sentinel environment.
Want to dive deeper or get access to the latest content and documentation? Everything is now available at docs.kaidojarvemets.com. If you’re a Premium Member and no access yet, please reach out!


