Introduction
HR asks: “How many devices did this user access from last week?“
Simple question. Should take 30 seconds to answer.
I didn’t have a SIEM. Just Entra ID portal exports and Excel.
What should have been a quick answer turned into an hour of manual work – downloading CSVs, removing duplicates, counting devices.
“What about IP addresses? Any unusual locations?“
Back to the CSVs. More Excel formulas. More manual correlation.
I needed to give answers, not excuses. But without proper tools, every investigation became a spreadsheet marathon. Excel had become my investigation platform – not by design, but by necessity.
This was my reality. Portal exports gave me raw data but no answers. Every investigation request turned into hours of Excel work just to answer basic questions.
I built Entra ID WatchTower because I needed a better way. Excel isn’t a SIEM, but it was what I had. So I made it work.
The Portal Problem Nobody Talks About
Not all Entra ID tenants are created equal. Organizations inherit different management approaches, configuration states, and data quality levels depending on who set them up and maintained them over time. Some tenants have clear naming conventions and proper logging. Others have inconsistent configurations or limited visibility.
The Entra ID portal gives you data, not answers:
- Export gives you raw sign-ins – count devices yourself
- No correlation between files – match data manually
- No analysis – build your own patterns
- No summaries – create your own counts
- Multiple file downloads – combine them yourself
- Basic questions become Excel projects
You end up downloading each CSV separately. Opening multiple Excel files. Counting devices manually. Sorting IPs by frequency. Building your own location analysis.
Basic questions become multi-hour projects:
- “How many unique devices?” – Count and deduplicate across files
- “Which locations did they access from?” – Build your own geo-analysis
- “What applications were used?” – Match app IDs to names manually
- “Any patterns?” – Good luck finding them in raw data
The Portal Wasn’t Built for Investigations
Here’s the truth: I couldn’t give good answers from portal exports. Not quickly. Not reliably.
Every “simple” question required:
- Downloading multiple CSVs
- Manual correlation in Excel
- Building my own analysis
- Hours of work for basic answers
Many organizations face this same reality. No SIEM. No log infrastructure. Just Excel and portal exports. When someone asks “Can you check this user’s activity?” you know you’re in for a long day.
The portal gives you data. It doesn’t give you answers. That’s the gap WatchTower fills.
What Entra ID WatchTower Actually Does
WatchTower skips the portal entirely. It connects directly to Microsoft Graph API and extracts complete sign-in data in one operation. No clicking through screens. No multiple downloads. No row limits.
One PowerShell command gives you answers, not raw data:
- “How many devices?” → Devices.csv has the count and details
- “Which locations?” → Locations.csv shows every access point
- “What IPs?” → IPAddresses.csv lists them with frequency
- “Which apps?” → Applications.csv with real names
- “Any travel?” → LocationTransitions.csv shows movement
- “When exactly?” → Timeline.csv has everything in order
Plus more files that answer questions before you ask them.
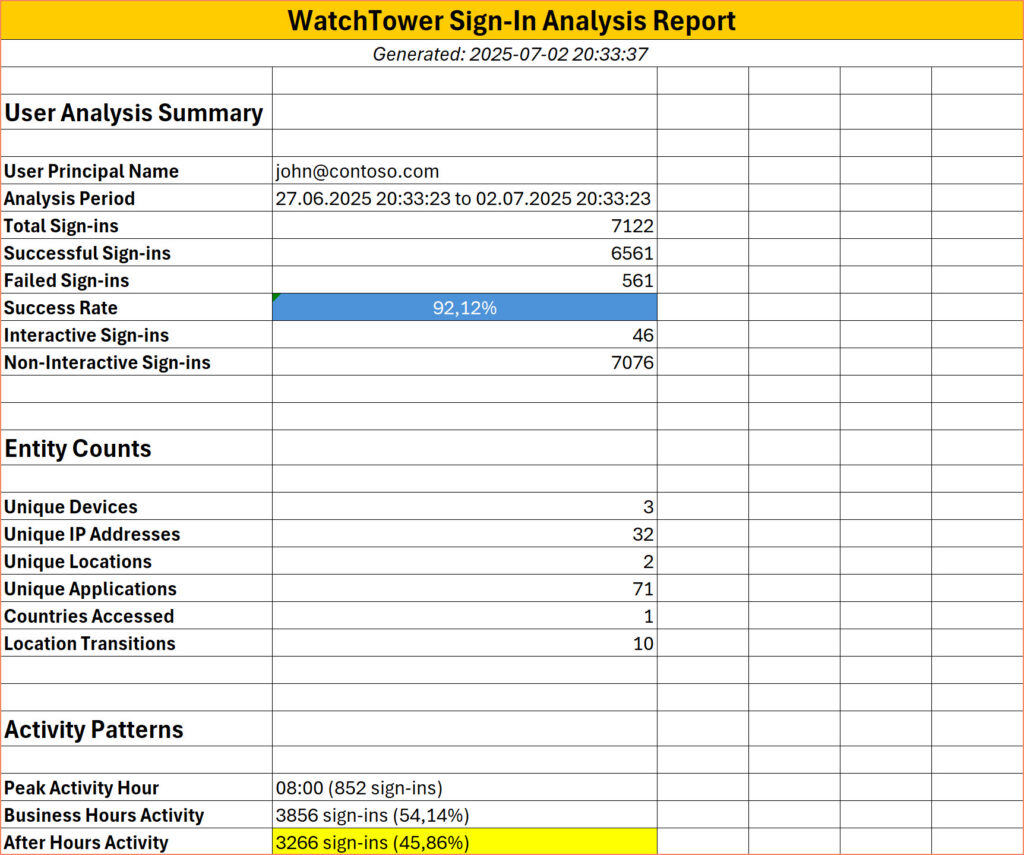
The combined Excel report (WatchTower_Report_[timestamp].xlsx) brings it all together with charts. No manual correlation. No pivot table building. Just answers.
The data gets organized into specialized CSV files – 17 different views:
- Timeline – Chronological events with full context (2.9 MB of detailed logs)
- Devices – All devices separated with compliance status and usage
- IP Addresses – Every IP with success rates and patterns
- Locations – Geographic access points with coordinates
- Applications – Which apps were accessed when
- Browsers – Browser types and versions used
- Countries – Access patterns by country
- Location Transitions – Movement between locations
- Hourly/Daily Patterns – Activity breakdown by time
- Business Hours – Work hours vs after-hours activity
- Suspicious Patterns – Flagged anomalies
- Device Anomalies – Unusual device behavior
- And more…
Plus a combined Excel report (WatchTower_Report_[timestamp].xlsx) that brings it all together with charts and summaries. Everything properly organized. No manual sorting needed.
Built Because I Needed Answers
I’ve been working with Azure and identity systems for 14 years as a Microsoft MVP. When investigation requests came in, I had two choices: spend hours in Excel or admit I couldn’t answer simple questions quickly.
Neither was acceptable.
WatchTower solves what I needed solved:
- Instant Answers – “How many devices?” becomes a single number, not a counting exercise
- Organized Data – Devices in one file, IPs in another, patterns pre-calculated
- No Infrastructure – Runs on any workstation with PowerShell and internet
- Complete Picture – Every sign-in with context, ready for analysis
The tool works because it was built from real investigation pain. Not theoretical requirements. Not feature lists. Just the need to answer questions without spending all day in Excel.
What You Actually Get
Organized Analysis Files
- Timeline.csv – Complete chronological activity
- Devices.csv – Every device counted and detailed
- IPAddresses.csv – All IPs with patterns identified
- Locations.csv – Geographic access mapped
- Applications.csv – Which apps, how often
- Plus 12 more specialized analysis files
Answers, Not Raw Data
- Device count? It’s in the summary
- Location patterns? Already analyzed
- Time patterns? Pre-calculated
- Application usage? Sorted and counted
Everything Investigation-Ready
- Timestamps readable, not epoch numbers
- Device names resolved, not just IDs
- Application names clear, not GUIDs
- IP addresses mapped to locations
- One Excel report brings it all together
What You’re Getting
Entra ID WatchTower turns investigation questions into quick answers.
Instead of spending hours in Excel counting devices, matching IPs to locations, or building timelines – you get organized files with the answers already there.
It pulls sign-in data directly from Graph API and creates 17 analysis files that answer the questions investigators actually ask. No more manual correlation. No more pivot table marathons.
Access for Premium Members
The complete Entra ID WatchTower package is available in the premium documentation library:
Download Entra ID WatchTower →
What’s in the package:
- Complete PowerShell solution (7 scripts)
- Ready to run – no development needed
- Creates 17 analysis CSV files per user
- Generates combined Excel reports
- All source code included
Download, extract, run. Start getting answers instead of excuses.
From Manual Hell to Automated Answers
Here’s what changed when I built WatchTower:
- Investigation time: Hours → Minutes
- Data accuracy: “I think” → “I know”
- Report quality: Raw dumps → Organized analysis
- My stress level: Through the roof → Actually manageable
The difference is proper data extraction and organization.
When you’re drowning in manual Excel work, having organized answers feels revolutionary.
The Bottom Line
I built Entra ID WatchTower because I was tired of not having answers. If you’re handling investigations without a SIEM, living in Excel, struggling with basic questions about user activity – this tool exists because I’ve been there.
Excel isn’t a SIEM. But with the right data extraction and organization, it becomes a workable investigation platform.
That’s what Entra ID WatchTower provides – the bridge between raw portal exports and actual answers.
Questions about specific investigation scenarios? Let me know in the comments.


