Introduction
Managing Windows Local Administrator Passwords is a key security task for IT teams. Windows Local Administrator Password Solution (LAPS) helps address this challenge, but how can you ensure it’s working correctly across your entire fleet? The answer lies in visualization through Microsoft Sentinel Workbooks.
Why Visualize Windows LAPS Data?
Collecting Windows LAPS events is just the first step. Without proper visualization:
- Security gaps might go unnoticed
- Trends in LAPS implementation could be missed
- Reporting to stakeholders becomes challenging
A well-designed Microsoft Sentinel Workbook transforms raw LAPS data into actionable insights, enabling proactive security management.
Key Benefits of a Windows LAPS Sentinel Workbook
- Clear Overview: Get a bird’s-eye view of LAPS implementation across your Windows fleet.
- Quick Issue Identification: Spot machines with misconfigured or missing LAPS settings at a glance.
- Trend Analysis: Track LAPS adoption and configuration changes over time.
- Compliance Reporting: Easily generate reports for audits and compliance checks.
- Customizable Insights: Tailor visualizations to your organization’s specific needs and risk factors.
Visualizations for Your LAPS Workbook
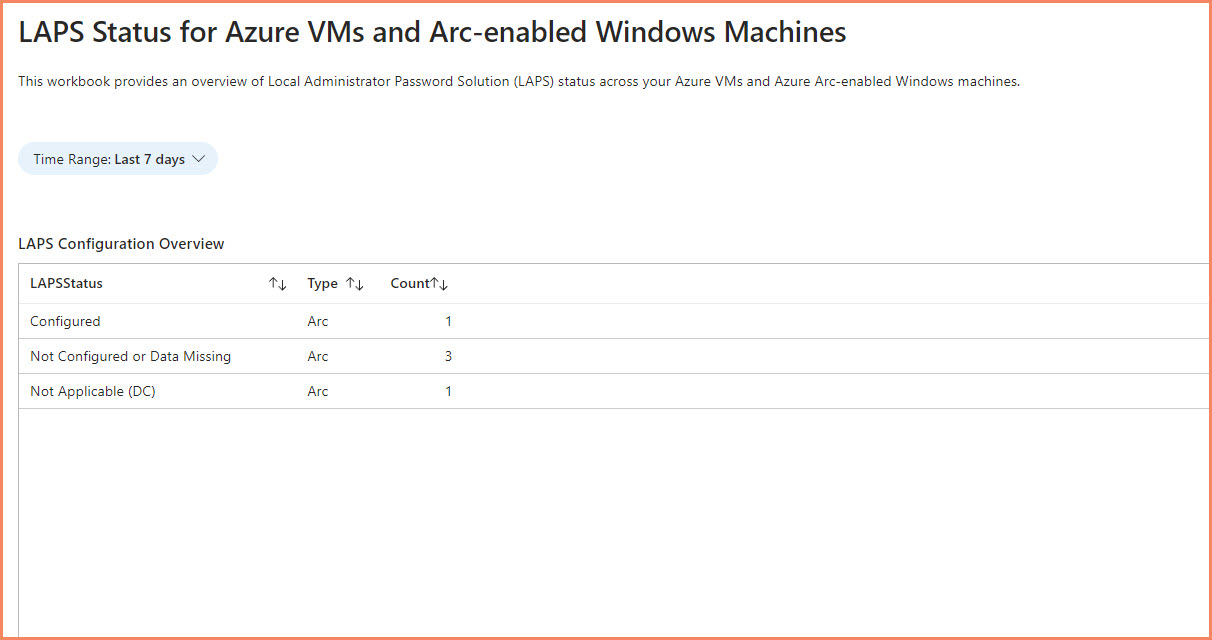
- LAPS Deployment Status
- Pie chart showing percentage of Windows machines with LAPS configured vs. not configured
- Password Age Distribution
- Bar chart displaying the age of LAPS-managed passwords across your fleet
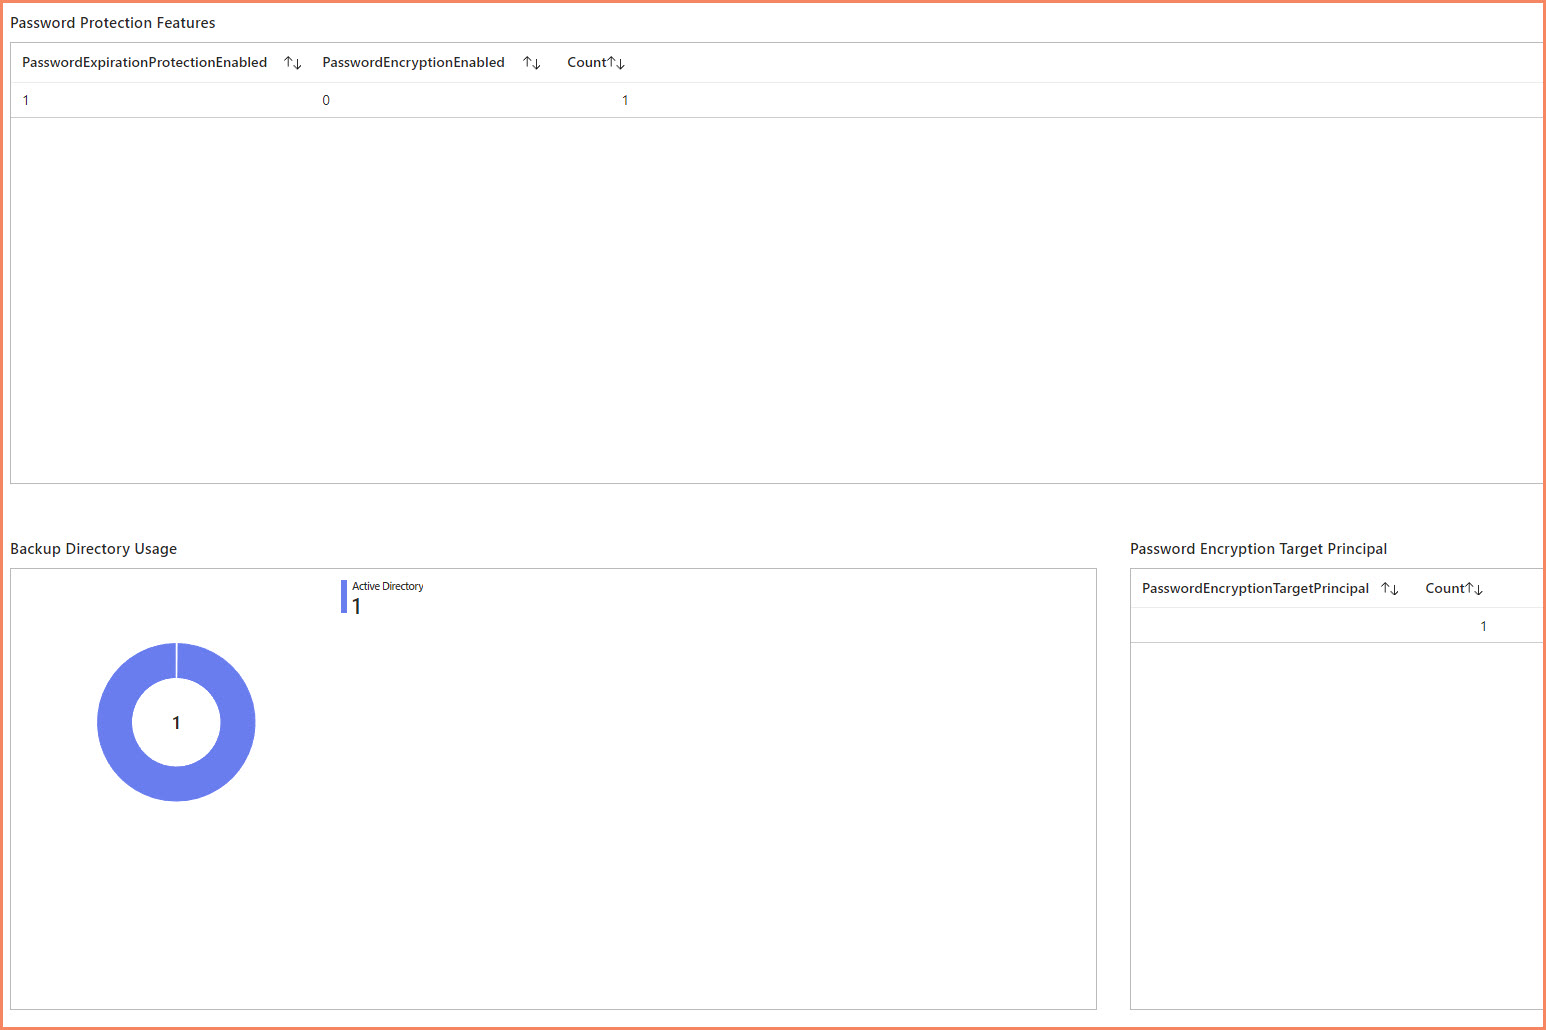
- Configuration Consistency
- Heat map highlighting variations in LAPS settings across different machine groups
- Historical Trend
- Line graph showing LAPS adoption and configuration changes over time
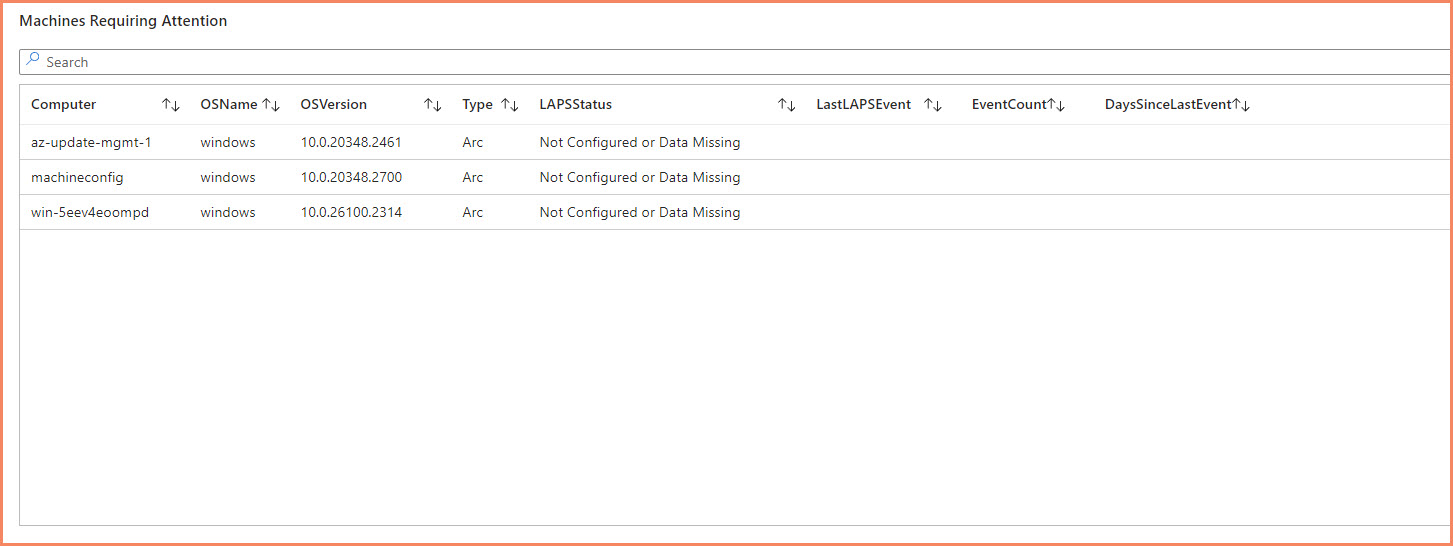
- Top Issues
- Table listing machines with LAPS-related problems, sorted by severity
Setting Up Data Collection for LAPS Events
Before creating your Workbook, you need to set up proper data collection. For a detailed guide on configuring Data Collection Rules (DCRs) for Windows LAPS events, please refer to our previous article: Monitor Windows LAPS Events with Microsoft Sentinel. This guide covers the steps to ensure you’re capturing the right data for your visualizations.
Best Practices for LAPS Visualization
- Regular Updates: Keep your Workbook queries current with the latest LAPS events and settings
- Role-Based Views: Create different Workbook tabs for various stakeholders (e.g., SOC analysts, IT admins, management)
- Integration with Other Data: Combine LAPS data with other security metrics for a holistic view
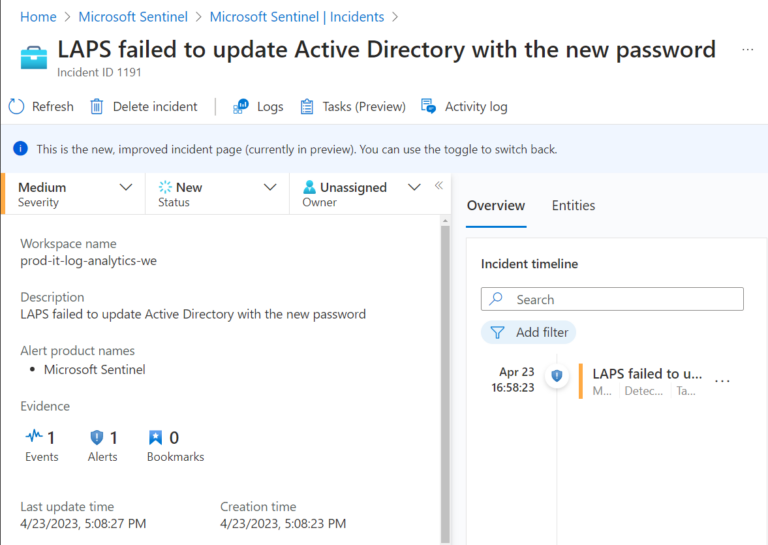
- Automated Alerting: Use Workbook insights to trigger Analytics Rules for proactive notification
Included Assets
To help you get started quickly, I have included two resources with this blog post:
- Microsoft Sentinel Workbook Template
- A pre-configured Workbook template that you can import into your Sentinel workspace. This template includes the key visualizations discussed in this article, saving you time in setting up your initial LAPS monitoring dashboard.
- KQL Query Collection
- A set of Kusto Query Language (KQL) queries designed for Windows LAPS monitoring. These queries form the basis of the Workbook visualizations and can be customized to fit your specific needs.
Conclusion
By visualizing Windows LAPS data through Microsoft Sentinel Workbooks, you transform raw events into a valuable security tool. This approach improves your ability to manage local administrator passwords and provides clear, actionable insights to keep your Windows fleet secure.
Start building your Windows LAPS Sentinel Workbook today and improve your security visualization.


